
3. Univariate data analysis
| 3.1 Frequency table and histogram (download) | |
|
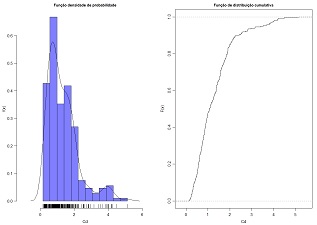
Compute a frequency table of a quantitative variable and plot a simple histogram and the cumulative histogram. Classes are of equal interval. Variables to customize: varlistindex <- 3 # index of the GTD frame variable |
 |
| 3.2 Equal frequency table and histogram (download) | |
|
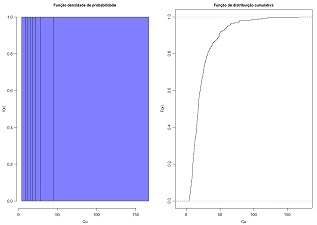
Plot a simple histogram of equal frequencies classes and the cumulative histogram. Variables to customize: varlistindex <- 11 # index of the GTD frame variable |
 |
| 3.3 Matrix of histograms (download) | |
|
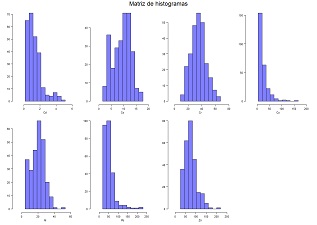
Plot a matrix of histograms of a set of quantitative variables. Variables to customize: nclasses <- 10 # number of histogram classes |
 |
| 3.4 Box plot (download) | |
|
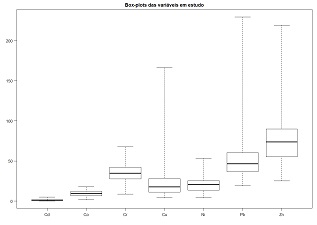
Draw one or several box-plots in the same graphic. Variables to customize: varlistindex <- c(5:11) # indexes of the GTD frame variables |
 |
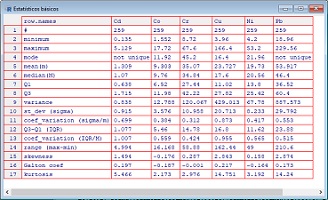
| 3.5 Table of univariate statistics (download) | |
|
Compute and display several univariate and basic statistics for one or several quantitative variables. The complete list is: minimum, maximum, mode, mean, median, Q1, Q3, variance, standard deviation, variation coeficients, IQR, range, skewness coeficient, Galton coeficient and kurtosis. Variables to customize: varlistindex <- c(5:11) # indexes of the GTD frame variables |
 |
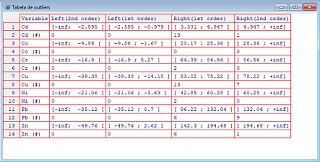
| 3.6 Table of outliers (download) | |
|
Compute and display the intervals and the number of individuals of the 1st and 2nd order outliers (left and right) for one or several quantitative variables. Variables to customize: varlistindex <- c(5:11) # indexes of the GTD frame variables |
 |
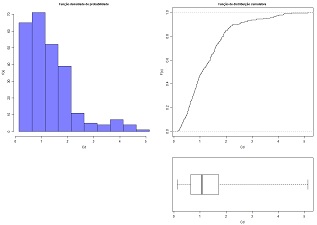
| 3.7 Histogram and box plot (download) | |
|
Display a simple histogram, a cumulative histogram and the box-plot of one quantitative variable. The box-plot is aligned with the cumulative histogram. Variables to customize: nclasses <- 10 # number of histogram classes |
 |
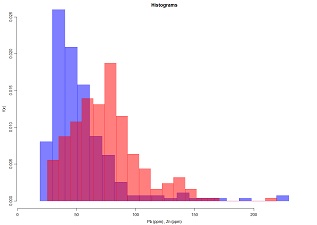
| 3.8 Two overlapped histograms (download) | |
|
Plot two histograms of two quantitative variables in the same graphic for sake of comparision. Variables to customize: nclasses <- 20 # number of histogram classes |
 |
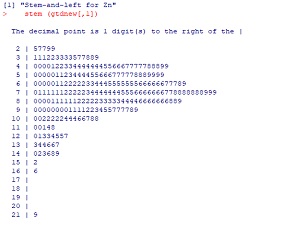
| 3.9 Stem and leaf plot (download) | |
|
Draw a stem and leaf plot. Variables to customize: varlistindex <- 11 # index of the GTD frame variable |
 |
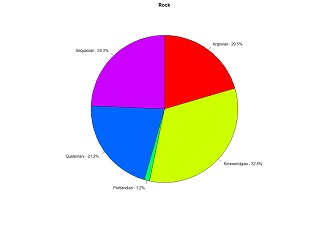
| 3.10 Bar diagram and/or pie chart for qualitative variables (download) | |
|
Plot a bar chart or pie chart for one qualitative variable. Variables to customize: histtype <- 2 # option for Pie (1) or Bars (2) |
 |
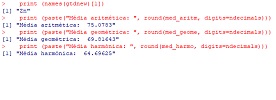
| 3.11 Arithmetic, harmonic and geometric means (download) | |
|
Compute and compare arithmetic mean, harmonic mean and geometric mean. Variables to customize: varlistindex <- 11 # index of the GTD frame variable |
 |
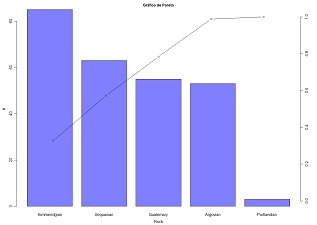
| 3.12 Pareto chart (download) | |
|
Draw a Pareto chart of a qualitative variable. Variables to customize: varlistindex <- 4 # index of the GTD frame variable |
 |