
1. Data in Geological Engineering
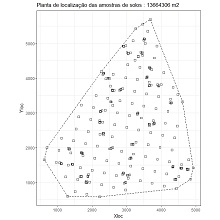
| 1.1 Aerial view of samples locations (download) | |
|
Plot an aerial view map (X, Y coordinates) of samples locations and optionally add a boundary polygon. Variables to customize: varcolX <- 1 # index of the GTD frame X coordinate |
 |
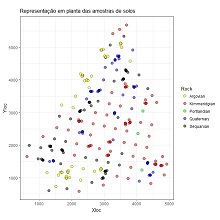
| 1.2 Aerial view of samples locations for Qualitative Variables (download) | |
|
Plot an aerial view map (X, Y coordinates) of samples locations with symbol colours of a qualitative variable. Variables to customize: varcolX <- 1 # index of the GTD frame X coordinate |
 |
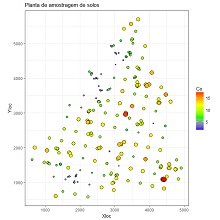
| 1.3 Aerial view of samples locations for Quantitative Variables (download) | |
|
Plot an aerial view map (X, Y coordinates) of samples locations with symbol colours of intervals of a quantitative variable. Variables to customize: varcolX <- 1 # index of the GTD frame X coordinate |
 |